FAQ
- M051 Base Series(95)
- M0518 Series(97)
- M0519 Series(43)
- M0564 Series(1)
- Mini51 Base Series(90)
- Nano100/102 Base Series(101)
- Nano103 Base Series(10)
- Nano110/112 LCD Series(100)
- Nano120 USB Series(111)
- Nano130 Advanced Series(110)
- NUC029 Series(94)
- NUC100/200 Advanced Series(102)
- NUC120/122/123/220 USB Series(116)
- NUC121/125 Series(1)
- NUC126 USB Series(2)
- NUC130/230 CAN Series(103)
- NUC131/NUC1311 CAN Series(98)
- NUC140/240 Connectivity Series(114)
FAQ
How to debug with watchpoint in Keil μVision or IAR EWARM? Issue Date:2019-10-01
Introduction:
Under debug mode in Keil μVision or IAR EWARM, when the setting condition is met, the watchpoint will stop the CPU for debugging. There are two common setting conditions as listed below.
(1) The expression condition is met.
(2) The target variable is read or written.
Scenario:
(1) Debugging memory access status.
(2) Debugging parameters with unexpected changes.
Keil μVision:
(1) Install the Nu-Link Keil Driver (required).
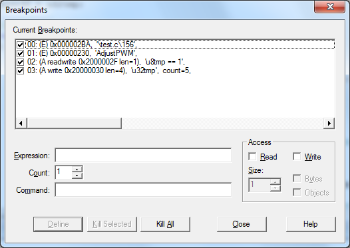
(2) Use “Ctrl+B” to open Breakpoints window.
(3) Supports “Access Break (A)”, “Execution Break (E)” and “Count”.

IAR EWARM:
(1) Install the Nu-Link IAR Driver (required).
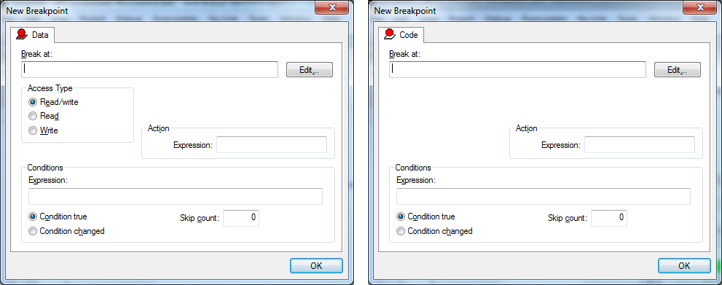
(2) Supports Data breakpoints with read and write access.
(3) Supports Code breakpoints with variable as a condition.
(4) Go to View -> Breakpoints window, right click on “New Breakpoint” and then select “Code” or “Data”.

| Products: | |
|---|---|
| Applications: | |
| Function: | Software and Tools,Development-Environment,IAR,Keil |